York Region Economic Data, Reports, and Resources
Please use the accordions below to find economic data, economic development reports and publications, startup and entrepreneurship supports, and more resources related to economic development in York Region.
57,000+
BUSINESSES
1,100
NEW BUSINESSES
Annual Average 2014 – 2023
630,000
LOCAL JOBS
750,000
LOCAL LABOUR FORCE
(Estimated 2024)
$71.8 BILLION
REAL GDP FOR YORK REGION
(2023)
1,260,000+
RESIDENTS
15,100+
POPULATION GROWTH
Annual Average (2014 – 2023)
238
DISTINCT ETHNICITIES
120
LANGUAGES SPOKEN
18
PUBLIC COLLEGES & UNIVERSITIES
(Within commuting distance)
13
FORTUNE 100 COMPANIES
WITH OPERATIONS IN YORK REGION
3 of GTA’S TOP 5
CORPORATE R&D SPENDERS HAVE MAJOR OPERATIONS IN YORK REGION
20%
OF GTA’S STEM & BUSINESS GRADUATES RESIDE IN YORK REGION
$7.6 BILLION 10-YEAR GROWTH INFRASTRUCTURE INVESTMENTS
(2024 Estimates)
$5.9 BILLION
IN TOTAL CONSTRUCTION VALUE
(2023)
Explore an interactive dashboard of York Region’s business community compiled from Canadian Business Counts data. Explore now.
The Employment Survey is survey of all businesses with a physical presence in the Region. Participate in the Employment Survey.
York Region’s Open Data portal is the public platform for exploring and accessing Regional data. View York Region’s Open Data Portal.
The 2022 Employment and Industry Report provides a detailed overview of trends in York Region. View the E&I Report.
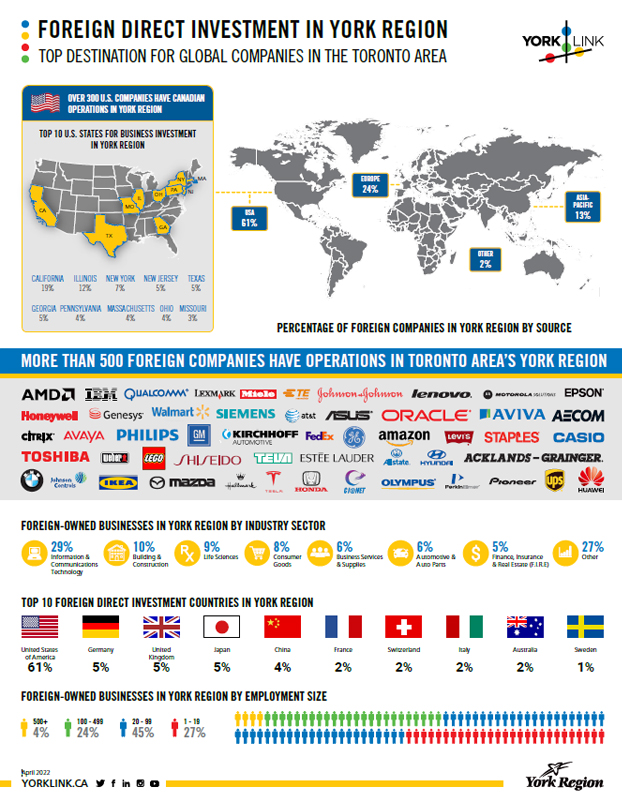
Businesses in York Region achieve high levels of economic performance with leading positions in top company indexes. View lists.
York Region Interactive Business Information Dashboard
Instructions for the Canadian Business Counts Dashboard
Geographies are organized into two dashboards. Click on the left or right arrows at the bottom of the Power BI Dashboard to switch from page 1 to page 2. For best functionality, you can also view a full screen version of this interactive dashboard.
Page 1 | York Region Dashboard:
- Primary Sectors Button: Displays a list of 2-Level NAICS. When selected, the charts illustrate each primary sector total, generating a grand total within the pie graph (top right).
- All Sectors Button: Provides a comprehensive list of 2-Level to 6-Level NAICS.
- Filters are available at the top left, grouped by NAIC Sectors filter and Employment Categories. Select “All” to view the business count and to generate a grand total. Click the Up or Down arrows to select individual categories by checking or unchecking the boxes.
- Pie graph (top right): shows the distribution of businesses by employer size range, updating dynamically with filter selections.
Page 2 | Local Municipalities and York Region Dashboard:
- Municipality Name Button: Select to view corresponding business counts by primary sectors (2-Level NAICS).
- Year Selection Button for 2023 and 2024 CBC data: Located at the top right, select one or both to view charts for each municipality.
This section offers a variety of statistics and data markers related to York Region’s labour force, Canadian census data, population growth, unemployment rates, and Canada’s Global Skills Strategy. It is for informational purposes only.
The Regional Municipality of York assumes no responsibility for any errors and is not liable for any damages of any kind resulting from the use or reliance on the content, accuracy, currency or completeness of the information provided in any application or document.
Labour Force Reports
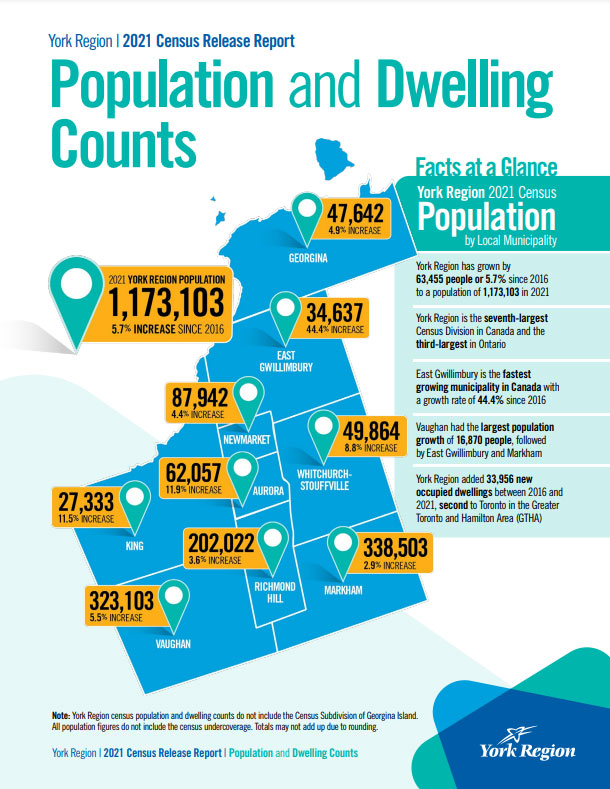
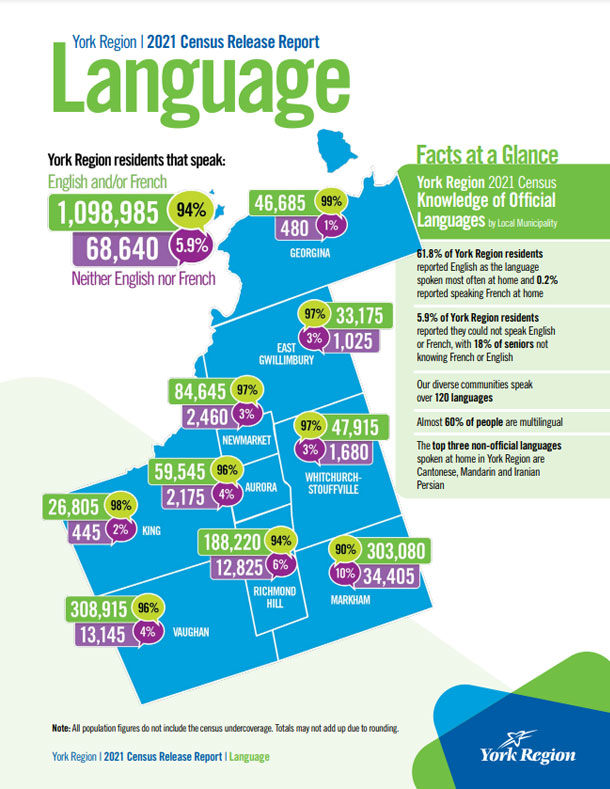
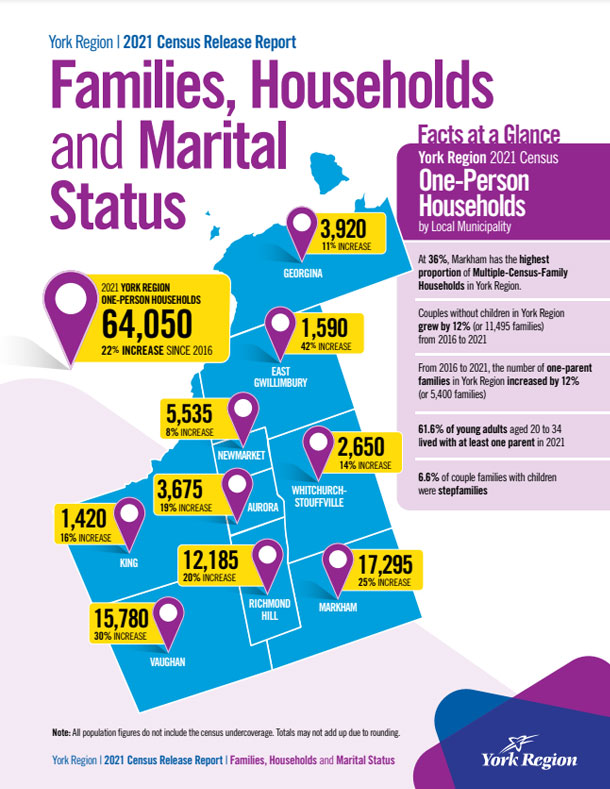
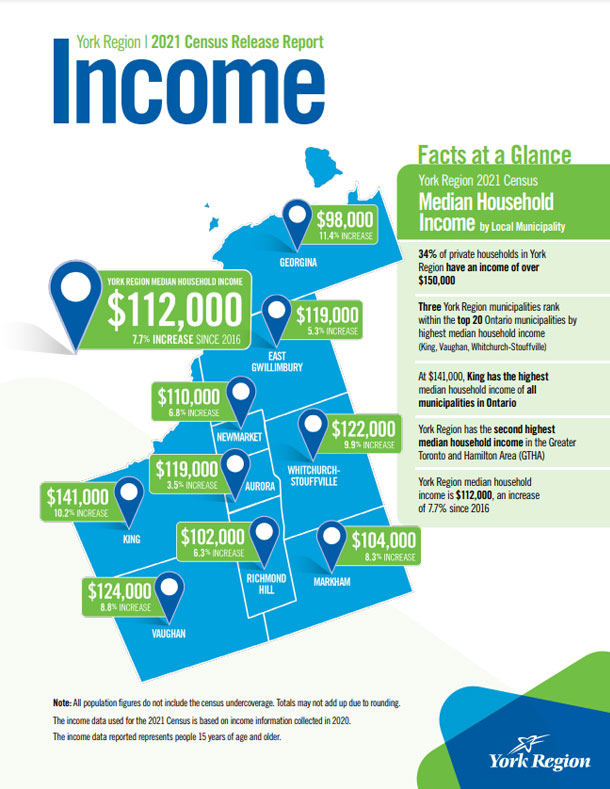
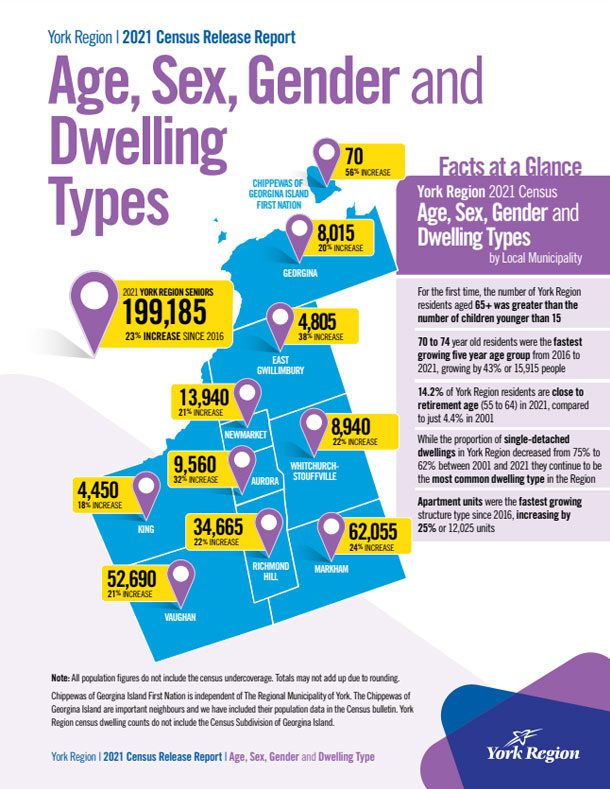
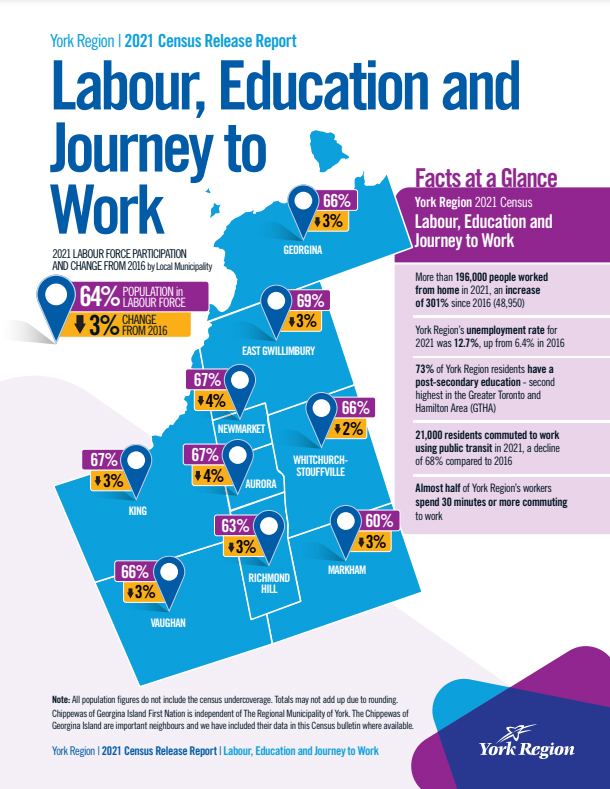
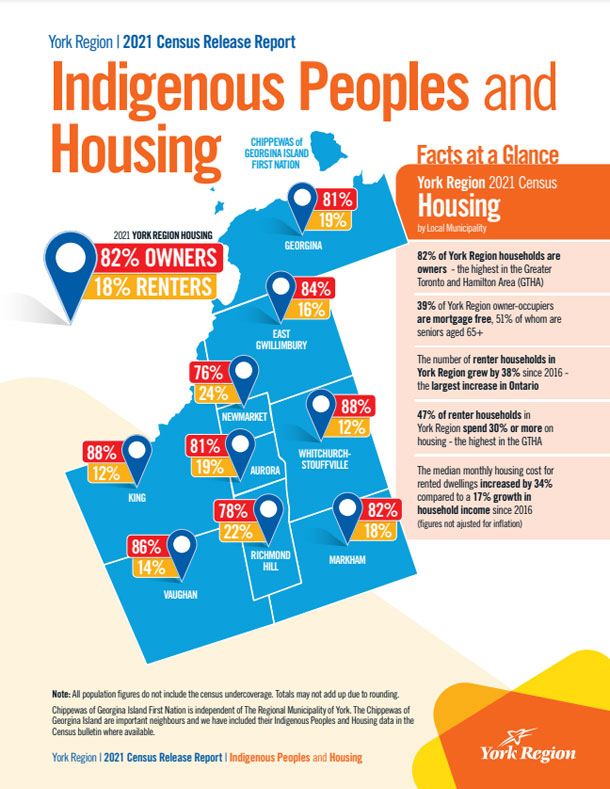
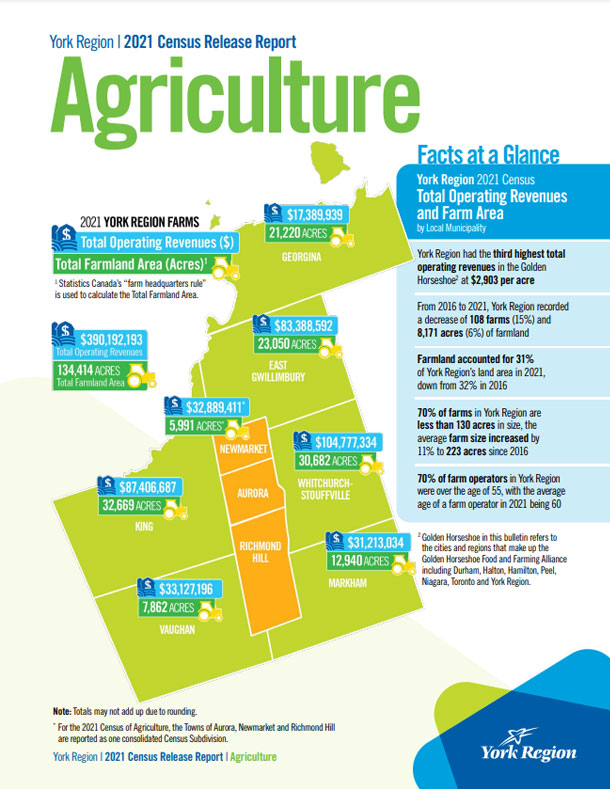
2021 York Region Canadian Census Data
York Region Population Growth
Unemployment Rates (%)
Source: Statistics Canada, Labour Force Characteristics, 3-month moving average, unadjusted for seasonality, NOC 2021, custom tabulation
*CMA – Census Metropolitan Area
Canada Global Skills Strategy
Canada’s Global Skills Strategy makes it easier for Canadian businesses to attract the talent they need to succeed in the global marketplace and York Region Economic Strategy is a designated referral part of the program. Whether recruiting professionals from around the world to train Canadian workers, or working with employers planning job-creating investments in Canada, the Global Skills Strategy provides businesses in Canada with a faster way to bring in global talent in order to scale-up and grow—creating better jobs for more Canadians.
Vacant Employment Lands Inventory Dashboard
The Vacant Employment Land Inventory (VELI) dashboard is a parcel-based inventory of employment lands within designated employment zones throughout York Region. Employment zones are designated in official plans and are defined as areas for business and economic activities that accommodate a wide range of uses such as industrial, commercial, institutional and knowledge-based industries. For forecasting and monitoring purposes, York Region divides employment into three main types: Major Office, Population-related and Vacant Land Employment. The focus of the inventory is on the vacant employment land parcels in the employment land zones. Rural parcels outside of our employment zone boundaries are not included in this inventory.
Industrial / Commercial Real Estate Market
Industrial Real Estate Market Vacancy & Availability Rates (%)
Source: CoStar
Statistics Note: Industrial properties include flex building space
Office Real Estate Market Vacancy & Availability Rates (%)
Source: CoStar
Statistics Note: Office building space at a minimum of 20,000 sq. ft.
NOTE: Due to the large volume of data in the data charts they may not appear as intended on mobile devices. It is recommended to view these charts on a desktop browser.
York Region’s business and academic community has a wide variety of innovation assets available to help support entrepreneurs, small businesses, and startups thrive. From makerspaces helping create product prototypes, to business incubators providing support and guidance, to networking organizations helping make new connections and co-location spaces offering office space – we’ve compiled them all here in one quick and easy to use guide.
York Region Economic Development Year In Review
Business incentives come in a variety of forms including, but not limited to, funding (loans & grants), landing support, and development charge deferrals and are offered through multiple levels of government. In this section you will find resources to available business incentives at a regional, provincial, and federal level. Additionally, York Region’s local municipalities may have additional business incentives available.
Regional Programs
Large Office Incentive Program
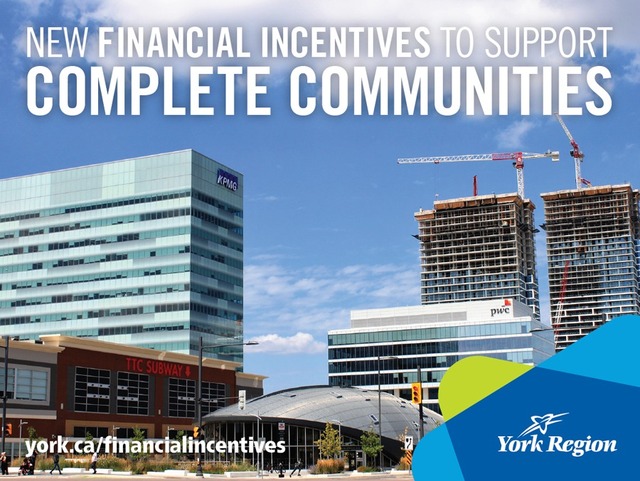
On October 24, 2024, York Regional Council approved a new large office incentive program to enhance York Region’s economic prosperity and job growth.
The large office incentive program, which targets office buildings 75,000 square feet or more and built in Regional growth centres, Major Transit Station Areas or Specific Local Centres includes a Development Charge Deferral of up to 20 years and a potential development charges discount.
Under the development charges deferral program, the full development charges payable could be deferred, interest free, for between 5 and 20 years and would not require a letter of credit. To qualify, buildings must also be a minimum of 4 storeys and local municipal participation is required. For further details, see the table below.
The ultimate decision on whether to implement the discount will be made as part of the update of the Region’s Development Charges Bylaw, which is expected to be brought forward to Council in February 2026.
Gross Floor Area Size Threshold | Duration of Development Charges deferral available on Regional Centres and Corridors, Major Transit Station Areas, or on specific Local Centres |
Between 75,000 square feet and less than 150,000 square feet | 5 years |
Between 150,000 square feet and less than 250,000 square feet | 10 years |
250,000 square feet and greater | 20 years |
For more information, please visit york.ca/developmentcharges or contact the Region at 1-877-464-9675, extension 71696 or 71660.
Industrial Development Charge Incentives
Reduction of Development Charges Where Gross Floor Area is Increased
3.16 Notwithstanding any other provisions of this bylaw, if a development includes the expansion of the gross floor area of an industrial, office or institutional building, the amount of the development charge that is payable in respect of the expansion shall be calculated as follows:
(a) If the gross floor area is expanded by fifty percent of the original gross floor area of the existing development, or less, the amount of the development charge in respect of the expansion is zero;
Source: Development Charges Bylaw 2022
DATA USAGE NOTICE:
The resources provided on this website can be shared, but a credit must be provided to York Region Economic & Development Services. If sharing on social media please tag the York Link channels.